At Group Two, your dedicated social and SEM teams are always on the ball, no matter what’s thrown at us — which means your social media and search engine marketing (SEM) strategies are in the best hands. Take a look at how the events of 2020 have altered key trends, and most importantly, how we’ve adapted.
Home Builder Social Media Marketing Trends
Election
Election ads throughout September and October took over Facebook and Instagram ad space, causing an increase in our “cost per thousand impressions,” or CPM, and an overall decrease in impressions. On average, we saw a 15-20% decrease in impressions and a 15-20% increase in CPM.
From what Facebook reported, there was a spend of at least $202,240,455 in the past 90 days from verified political pages, including the pages of Joe Biden, Donald Trump, Kamala Harris, and Mike Pence, as well as affiliated political organizations.
This spend was also spread differently across various states, and therefore affected builders in certain states differently. For example, in the past 90 days, ad spend was at least $20 million dollars higher in PA, CA, and FL than in any other state. Now that the election is over, we are starting to see impressions and costs fall back into what we normally expect to see.
Increase in Usage
This may come as no surprise, but according to Sprout, one of the largest social media platforms around, 50% of consumers said they have increased their usage of social media within the last 6 months, and 68% say they plan to use it more in the upcoming year. Especially with Covid cases on the rise again, we expect to continue to see an increase in usage for the foreseeable future, which means we will continue to emotionally connect with the audience throughout the holiday season!
Engagement By Industry
In 2020, companies in the real estate industry saw an average of 6 engagements per post. This average was the lowest for ANY industry, tied with education. On the other hand, the real estate industry sees one of the highest response rates (via comments and messages) on social media at 29%, only tied with legal. This brings us to the increasing importance for OSCs to have a presence on social media pages.
Prospects utilize a multitude of ways to reach out to builders, not just on their website. We consistently see prospects reaching out to builders via Facebook Messenger, as well as inquiring directly on posts and ads. With social media messaging becoming more popular among prospects, builders should designate someone to respond to these inquiries directly, like an online sales counselor, or OSC. OSCs should be active on social media in order to respond quickly and get prospects in the pipeline!
Sports, Sports, Sports!
45% of consumers say they’re most likely to use social media during a sporting event, and when asked when they are most interested in seeing brand content in their feeds, 54% of consumers welcome brand posts during those sporting events. To get in front of prospects at the right time, we made sure to schedule social posts for Thursday nights and Sundays! (We also mixed in a couple of football puns to remain relevant, of course).
Home Builder SEM Trends
Search Growth
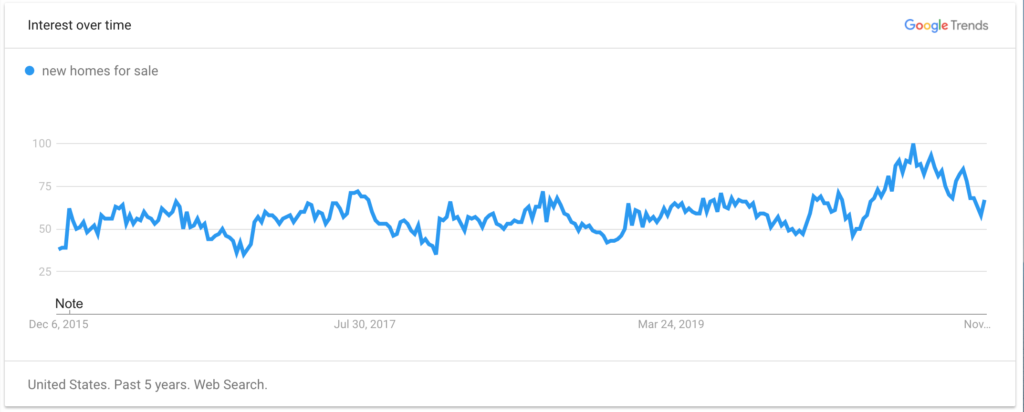
As overall market demand for new homes soared in 2020, so did search volume on Google. While it varies by market, search volume specific to home buying on average increased 22% in 2020 vs. 2019, with 55% of all searches coming from mobile
Ad Click-Through Rate (CTR) & Ad Depth
CTR is the number of clicks your ad receives divided by the number of times your ad is shown: clicks ÷ impressions = CTR. For example, if you had 5 clicks and 100 impressions, then your CTR would be 5%. Ad CTR grew 15% year over year.
A contributing factor to the growth in CTR YoY is the continued increase in ad depth. Ad depth is the number of ads shown whenever a search showed ads (Impressions ÷ queries with ads). The average ad depth in 2020 so far is 3.7, a 7% increase YoY.
More paid results appearing in a search increases the likelihood that users will click on a paid result vs. an organic result. Additionally, Google Ads has gradually redesigned its search results page to favor paid results. Therefore, for many searches, every link above the fold is now a paid advertisement. As it becomes harder for users to distinguish between organic search and paid search results, an effective home builder SEM strategy has never been more important.
Even if you rank well for certain keywords organically, if you are not also bidding on those same keywords, you are likely going to lose traffic to builders who are appearing in the paid results at the top of the page. As Google looks to maximize its advertising revenue, and continues to be the dominant player in paid search, this trend is likely here to stay, so it’s important for you to plan your 2021 media strategy accordingly.
Decrease in Cost-Per-Click (CPC)
While factors such as historical campaign performance and unique optimization strategies affect individual CPC, so far in 2020, we’ve seen the average CPC on Google paid search decrease 21%. The reason for this is basic supply and demand economics. A change in balance of supply and demand can drive ad costs up and down very quickly in the ad ecosystem. As illustrated above, search volume increased significantly in 2020 vs. 2019 (supply), while home builder ad spend (demand) did not increase proportionally, resulting in this significant CPC decrease.
This trend has been a nice positive for builders — most of whom have seen increased paid search traffic, leads, and impression share without having increased their budget. While these low CPCs won’t last forever, they will likely continue at least through early 2021.
It’s safe to say that a lot has changed in the past year, but you can be sure that your team at Group Two has you covered no matter what.