Current cultural shifts will affect your processes for the time being, but you can rest assured that one thing’s constant — Group Two is on top of everything you need to know to optimize your advertising strategy and amplify results. We’ve compiled recent data regarding the social media and digital tactics we’ve used for our builders, so you can see what worked, and what will work in the near future as we continue to embrace a new normal.
Social Media
Our builders’ Q1 roll-up data from social media started off strong with an increase of 14% in website conversions from the previous quarter. Over the past year, the social team changed our traffic-driving ads to ads that were optimized for website conversions, and have seen an overall increase in conversions due to that shift!
Devices for Social:
While in Q1, over 90% of actions taken on social media occurred on mobile, however amid “Stay at Home Orders” we are seeing across the country, we’re now seeing an increasing trend in engagements taken on desktop! It is really important to pay attention to these numbers.
Ads that you created 30 + days ago could be the type of ads that only show on mobile devices. While this was a good strategy then you need to adjust accordingly for the environment you are in now. We highly recommend changing out the creative on your ads to be desktop friendly as well as mobile friendly, so you hit both audiences and don’t miss out on potential opportunities.
Social to Site:
In Q1, we saw that paid social and organic social combined, on average, accounted for 20-25% of the traffic to our builders’ websites, and users spent an average of a little over 1.5 minutes on site. In the past few weeks since the quarter ended, while we have seen a decrease in total website traffic overall (as of this writing),from it’s 12 month high pre COVID, we’ve also seen traffic to the site from paid and organic social sources increase to 25-30%, and users are spending close to 2 minutes on site.
Because we’re also seeing an increase in website traffic from organic social media specifically, make sure the content you push out on social media is top notch right now. Check out our blog for helpful tips on what you can post based on the assets you already have!
Quarter Two Predictions:
While overall website traffic from the end of Q1 may look like it’s decreasing, we are on the rise and have been since around March 20th and we expect to continue to see an overall increase from social media as well as an increase in conversions(leads), due to the fact that users are spending more time consuming content across their social media channels.
SEM and SEO
Paid Search:
Average Cost Per Click (CPC) increased in Q1 versus the same time last year by about 12%. The second half of March largely was responsible for this increase, as search activity temporarily declined for “new homes.” Because search activity declined, advertisers were bidding on a smaller pool of searchers; due to the laws of supply and demand, this increases the cost of a click on Paid Search. Because the decline in search activity appears to be temporary, this year over year increase in CPC is unlikely to continue into Q2.
Organic Search:
Organic searches for “new homes for sale” and related searches trended down in March after strong volume in January and February. Organic search reached a low point in the third week of March, and while it has not yet returned to pre-Covid levels, it has been steadily increasing.
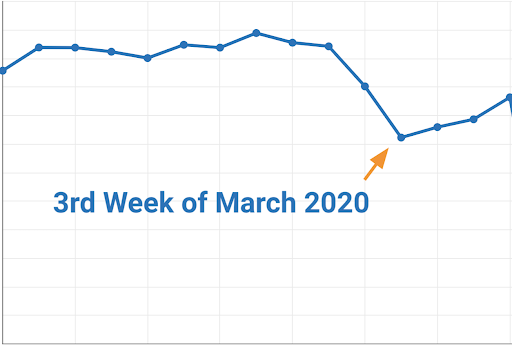
Google Search Trends
Virtual Home Tours:
As people shifted their daily routines, they also shifted how they search for new homes online. The spike in week 3 of “virtual home tours” is a dramatic illustration of this.